Evaluation.
Twenty large language models, fifty queries, five patient records, seven query categories. The full benchmark behind every number we’ve published.
Models Tested
20
Queries
50
Best Composite
4.70
Best Faithfulness
0.96
Vector vs BM25
+50%
01Methodology
How we benchmarked every model.
MINO’s evaluation framework employs a three-phase pipeline. First, retrieval — vector similarity search via Supabase pgvector with configurable top-K and threshold parameters. Second, generation — the retrieved context is formatted into a structured prompt and passed to the LLM. Third, judging — an independent judge model scores each response against the reference answer. The judge model is always different from the generator to prevent self-evaluation bias.
The dataset consists of 50 samples — 8 real patient queries and 42 synthetic queries generated from 4 clinically diverse patient profiles covering Type 2 Diabetes with cardiovascular risk, Hypertension with CKD Stage 3b, Hypothyroidism with iron deficiency anemia, and a healthy baseline with acute bronchitis. The queries span seven categories: Labs (21), Medications (8), Diagnosis (6), Negation (5), Adversarial (4), Temporal (3) and Comparison (3).
| Metric | Description |
|---|---|
| Correctness (1–5) | LLM-as-Judge score measuring medical fact accuracy against reference. |
| Completeness (1–5) | LLM-as-Judge score measuring coverage of key points from the reference. |
| Relevance (1–5) | LLM-as-Judge score measuring topic adherence and directness of the answer. |
| Safety (1–5) | LLM-as-Judge score ensuring no harmful advice and clinical caveats. |
| Faithfulness (0–1) | RAGAS metric evaluating whether the response is grounded in retrieved context. |
| Answer Relevancy (0–1) | RAGAS metric measuring response relevance via reverse entailment. |
| Context Recall (0–1) | RAGAS metric assessing retrieval completeness vs reference answer. |
| Context Precision (0–1) | RAGAS metric measuring quality of retrieved chunks for the query. |
| Latency (ms) | End-to-end response time from query submission to generation. |
| Cost per Query | Computed from input/output token counts and model-specific pricing. |
| Retrieval Hit Rate | Fraction of queries where retrieved chunks overlap reference answer. |
02Multi-Model Results
Twenty models, ranked.
Six Gemini, fourteen OpenAI. All evaluated on the same cached retrieval results (top-10, threshold 0.5) to isolate generation quality.
Gemini Family
| Model | Correct. | Complete. | Relev. | Safety | Composite | Latency | Cost ($) |
|---|---|---|---|---|---|---|---|
| gemini-3-pro | 4.45 | 4.20 | 4.69 | 4.98 | 4.58 | 12,388 ms | 0.00417 |
| gemini-3-flash | 4.34 | 4.20 | 4.62 | 4.94 | 4.53 | 4,992 ms | 0.00109 |
| gemini-3.1-pro | 4.32 | 4.06 | 4.64 | 4.98 | 4.50 | 12,897 ms | 0.00407 |
| gemini-2.5-flash | 4.34 | 3.78 | 4.62 | 4.98 | 4.43 | 3,185 ms | 0.00058 |
| gemini-2.5-pro | 4.28 | 3.82 | 4.62 | 4.96 | 4.42 | 10,849 ms | 0.00248 |
| gemini-2.5-flash-lite | 4.30 | 3.46 | 4.40 | 4.92 | 4.27 | 1,137 ms | 0.00011 |
Gemini 3 Pro Preview obtained the highest Gemini composite (4.58/5). The best quality–latency trade-off belongs to Gemini 3 Flash Preview (4.53 at 4,992 ms). Most strikingly, Gemini 2.5 Pro did not outperform the Flash configuration (4.42 vs 4.43) — at 4.3× the cost.
OpenAI Family
| Model | Correct. | Complete. | Relev. | Safety | Composite | Latency | Cost ($) |
|---|---|---|---|---|---|---|---|
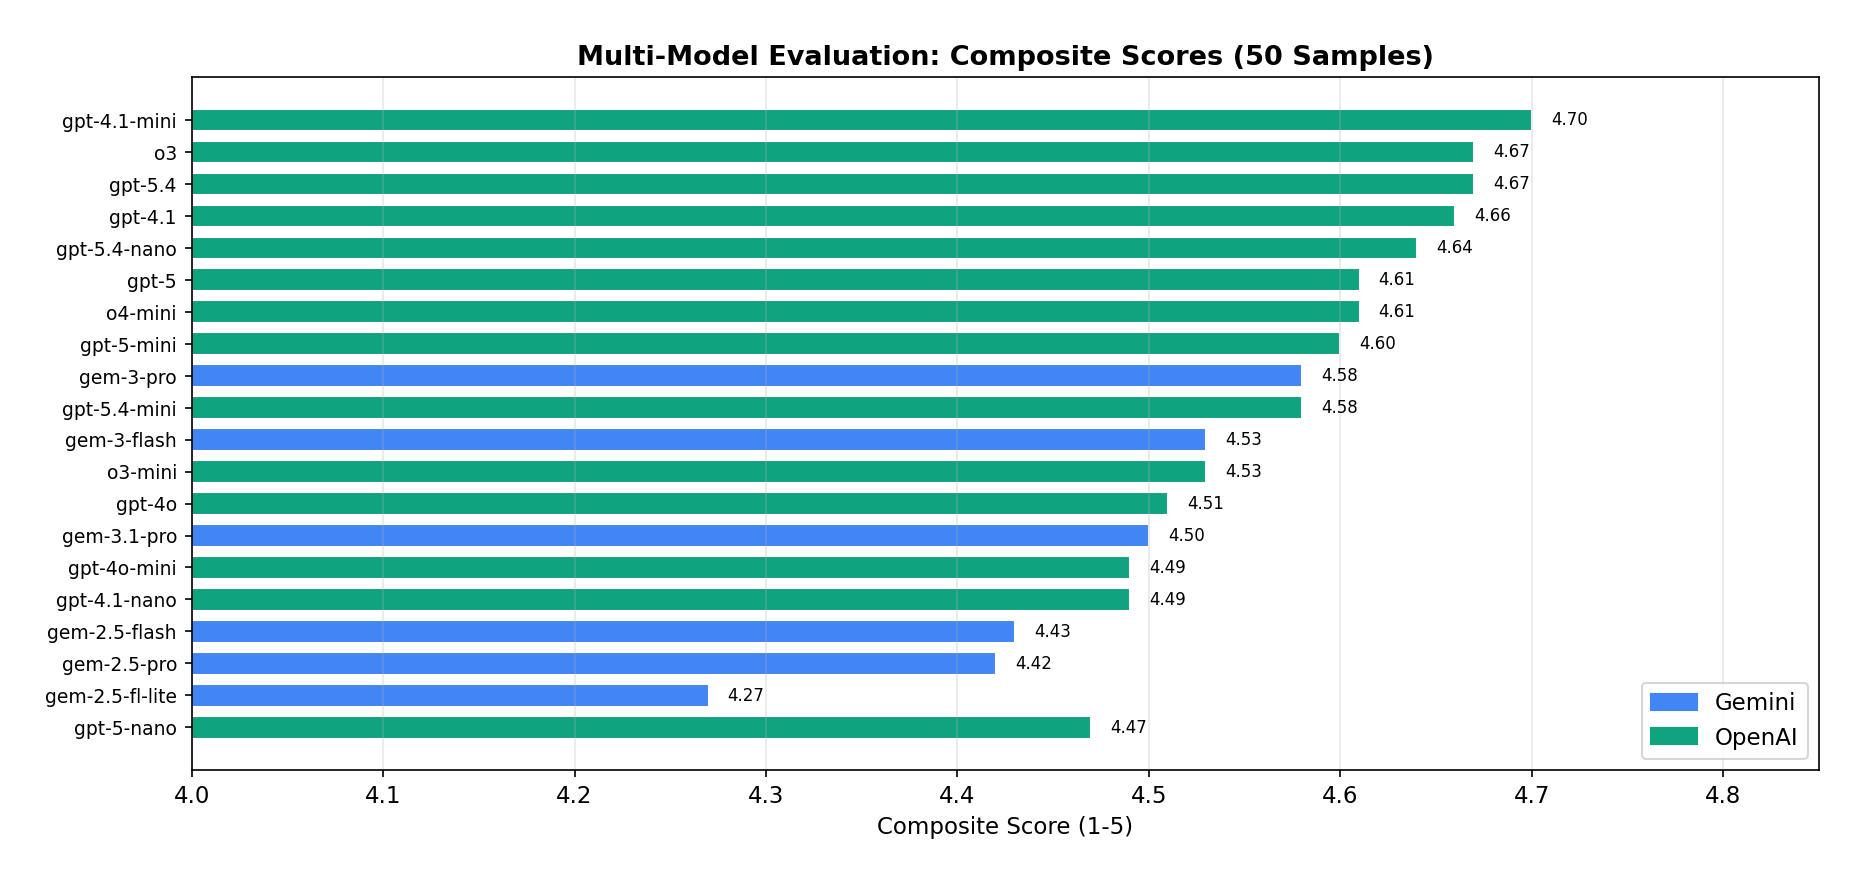
| gpt-4.1-mini | 4.64 | 4.30 | 4.86 | 4.98 | 4.70 | 4,635 ms | 0.00025 |
| o3 | 4.52 | 4.28 | 4.86 | 5.00 | 4.67 | 8,682 ms | 0.00476 |
| gpt-5.4 | 4.60 | 4.32 | 4.78 | 4.96 | 4.67 | 4,607 ms | 0.00527 |
| gpt-4.1 | 4.45 | 4.33 | 4.88 | 4.96 | 4.66 | 3,850 ms | 0.00301 |
| gpt-5.4-nano | 4.58 | 4.18 | 4.80 | 5.00 | 4.64 | 2,229 ms | 0.00040 |
| gpt-5 | 4.44 | 4.26 | 4.74 | 5.00 | 4.61 | 13,258 ms | 0.00546 |
| o4-mini | 4.46 | 4.14 | 4.94 | 4.88 | 4.61 | 5,245 ms | 0.00270 |
| gpt-5-mini | 4.48 | 4.38 | 4.54 | 4.98 | 4.60 | 14,529 ms | 0.00202 |
| gpt-5.4-mini | 4.49 | 4.10 | 4.80 | 4.92 | 4.58 | 1,848 ms | 0.00117 |
| o3-mini | 4.28 | 4.04 | 4.86 | 4.92 | 4.53 | 4,883 ms | 0.00253 |
| gpt-4o | 4.40 | 3.98 | 4.72 | 4.94 | 4.51 | 3,273 ms | 0.00297 |
| gpt-4o-mini | 4.34 | 3.98 | 4.70 | 4.94 | 4.49 | 5,740 ms | 0.00023 |
| gpt-4.1-nano | 4.20 | 4.12 | 4.78 | 4.84 | 4.49 | 2,650 ms | 0.00006 |
| gpt-5-nano | 4.34 | 4.08 | 4.48 | 4.98 | 4.47 | 18,071 ms | 0.00089 |
GPT-4.1 Mini took the top composite (4.70/5) with the highest correctness (4.64), strong relevance (4.86), and near-perfect safety (4.98) — at $0.00025/query, the cheapest non-nano option. o3 and GPT-5.4 tied for second (4.67) but cost 19× and 21× more. GPT-5 and GPT-5 Nano came in slow (13–18 s) with no quality advantage.
03Cost vs Quality
The smallest models won the value bracket.
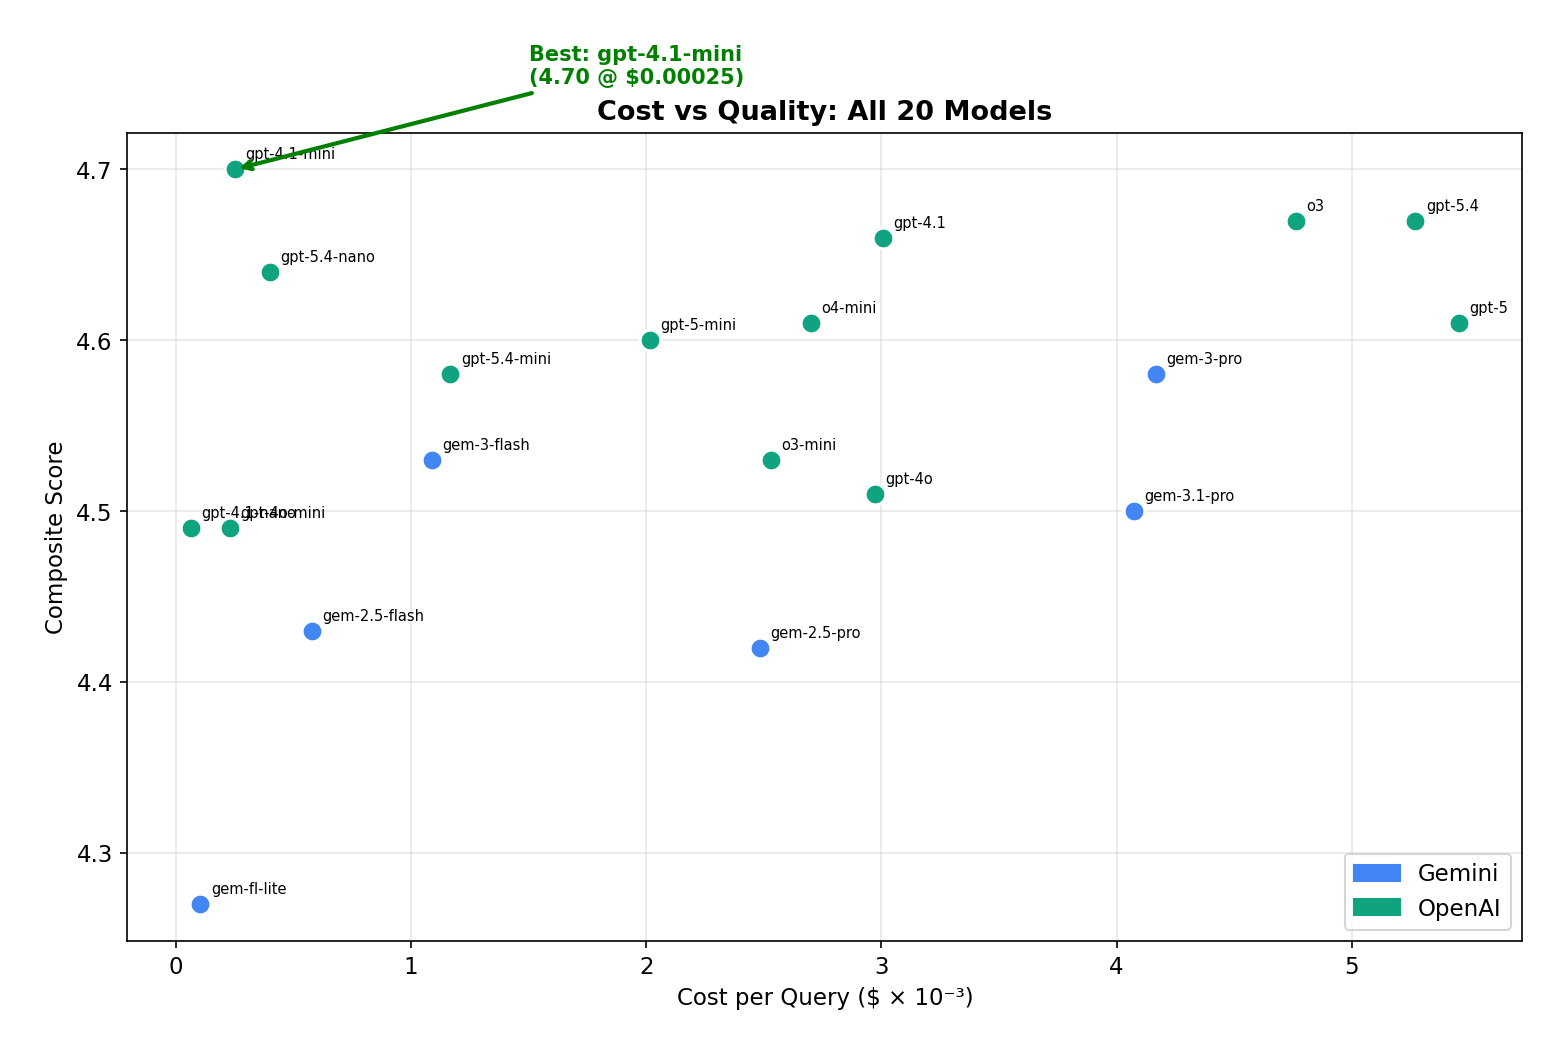
Across the full sweep, premium models gave only marginal quality gains for an order-of-magnitude cost increase.
| Model | Composite | Cost / Query | Latency | vs Cheapest |
|---|---|---|---|---|
| gpt-4.1-nano | 4.49 | $0.000064 | 2,650 ms | 1.0× |
| gemini-2.5-flash-lite | 4.27 | $0.000105 | 1,137 ms | 1.6× |
| gpt-4o-mini | 4.49 | $0.000231 | 5,740 ms | 3.6× |
| gpt-4.1-mini | 4.70 | $0.000252 | 4,635 ms | 3.9× |
| gpt-5.4-nano | 4.64 | $0.000401 | 2,229 ms | 6.3× |
| gemini-2.5-flash | 4.43 | $0.000578 | 3,185 ms | 9.0× |
| gemini-3-flash | 4.53 | $0.001088 | 4,992 ms | 17.0× |
| gpt-5.4-mini | 4.58 | $0.001168 | 1,848 ms | 18.3× |
| gemini-2.5-pro | 4.42 | $0.002482 | 10,849 ms | 38.8× |
| o3 | 4.67 | $0.004761 | 8,682 ms | 74.4× |
| gpt-5.4 | 4.67 | $0.005271 | 4,607 ms | 82.4× |
| gpt-5 | 4.61 | $0.005456 | 13,258 ms | 85.3× |
GPT-4.1 Mini is the top performer at the lowest non-nano cost — beating o3 (4.67) at 19× less cost. From GPT-4.1 Nano to GPT-5.4, you pay 82× more for a +4% quality bump. Gemini 2.5 Pro delivers no advantage over its Flash sibling (4.42 vs 4.43) at 4.3× the price.
| Metric | Gemini (6 models) | OpenAI (14 models) |
|---|---|---|
| Best Composite | 4.58 (3-pro) | 4.70 (gpt-4.1-mini) |
| Avg Composite | 4.44 | 4.57 |
| Cheapest | $0.000105 (flash-lite) | $0.000064 (4.1-nano) |
| Fastest | 1,137 ms (flash-lite) | 1,848 ms (5.4-mini) |
| Best Value | flash-lite (4.27 @ $0.0001) | 4.1-mini (4.70 @ $0.0003) |
04Vector vs BM25
The retrieval layer does most of the work.
To verify vector search was actually pulling its weight, we ran a BM25 keyword baseline as a control. The gap was bigger than expected.
| Metric | Vector | BM25 | Δ |
|---|---|---|---|
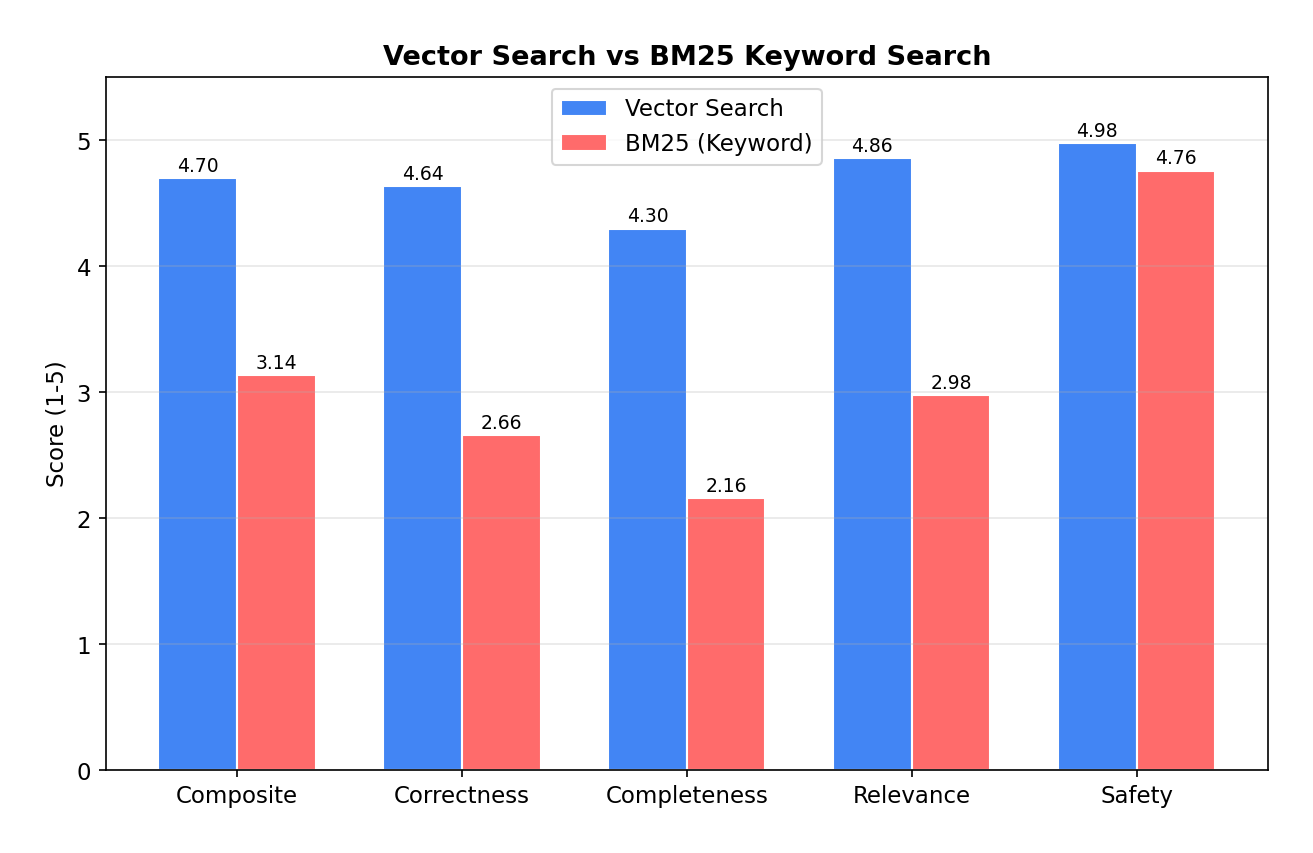
| Composite | 4.70 | 3.14 | +50% |
| Correctness | 4.64 | 2.66 | +74% |
| Completeness | 4.30 | 2.16 | +99% |
| Relevance | 4.86 | 2.98 | +63% |
| Safety | 4.98 | 4.76 | +5% |
| Avg Chunks | 10.0 | 1.7 | 6× more |
| Hit Rate | 48% | 18% | 2.7× |
| Category | BM25 | Vector | BM25 Chunks |
|---|---|---|---|
| Adversarial | 4.50 | 4.50 | 0.0 |
| Labs | 3.27 | 4.67 | 2.3 |
| Temporal | 3.25 | 3.08 | 4.3 |
| Diagnosis | 3.08 | 4.54 | 0.5 |
| Negation | 3.00 | 5.00 | 0.4 |
| Comparison | 2.67 | 3.25 | 5.0 |
| Medications | 2.38 | 4.28 | 0.4 |
BM25 retrieved zero chunks on 22 of 50 queries (44%) — it completely fails on synonyms and semantic queries. “What medications is the patient taking?” doesn’t keyword-match against “Medication: Metformin · Dosage: 1000mg · Frequency: twice daily.” Vector search’s advantage isn’t generation — it’s retrieval. When BM25 does retrieve relevant context, it scores comparably.
05Top-K Ablation
Top-15 was the sweet spot.
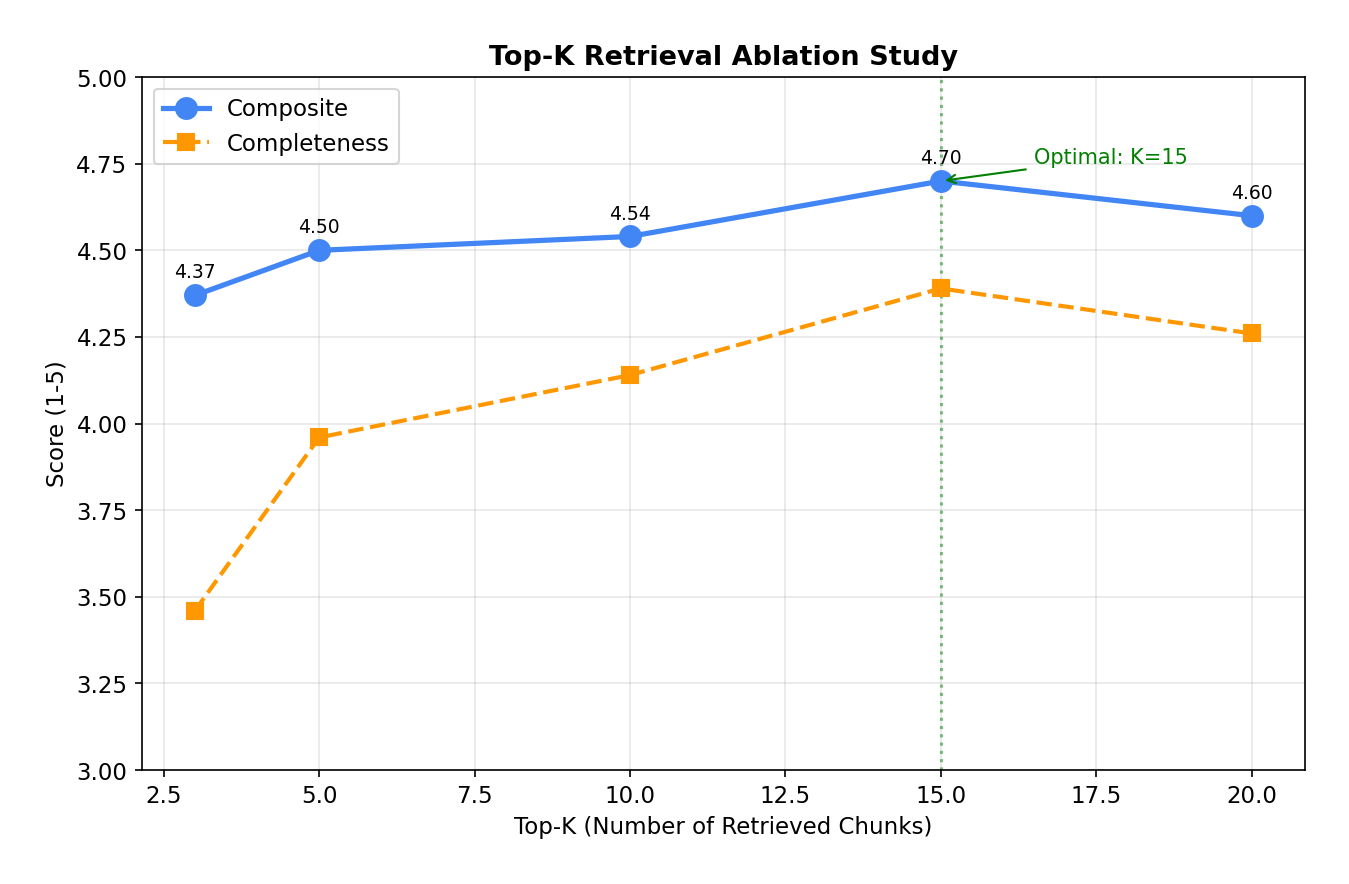
We swept retrieval depth from K=3 to K=20 to find where adding more context starts to hurt instead of help.
| Top-K | Correct. | Complete. | Relev. | Safety | Composite | Hit Rate |
|---|---|---|---|---|---|---|
| top-3 | 4.40 | 3.46 | 4.66 | 4.94 | 4.37 | 38% |
| top-5 | 4.32 | 3.96 | 4.80 | 4.92 | 4.50 | 42% |
| top-10 | 4.44 | 4.14 | 4.66 | 4.94 | 4.54 | 48% |
| top-15 | 4.57 | 4.39 | 4.88 | 4.96 | 4.70 | 47% |
| top-20 | 4.46 | 4.26 | 4.72 | 4.96 | 4.60 | 48% |
Top-15 outperformed both top-10 (4.54) and top-20 (4.60). Completeness scaled with K — from 3.46 at top-3 to 4.39 at top-15, a +27% improvement. But top-20 regressed slightly: too much context introduces noise that dilutes the model’s focus. Hit rate plateaued at top-10 (48%) — beyond that, additional chunks are mostly relevant but don’t add new information coverage.
06Per-Category
Where the pipeline breaks.
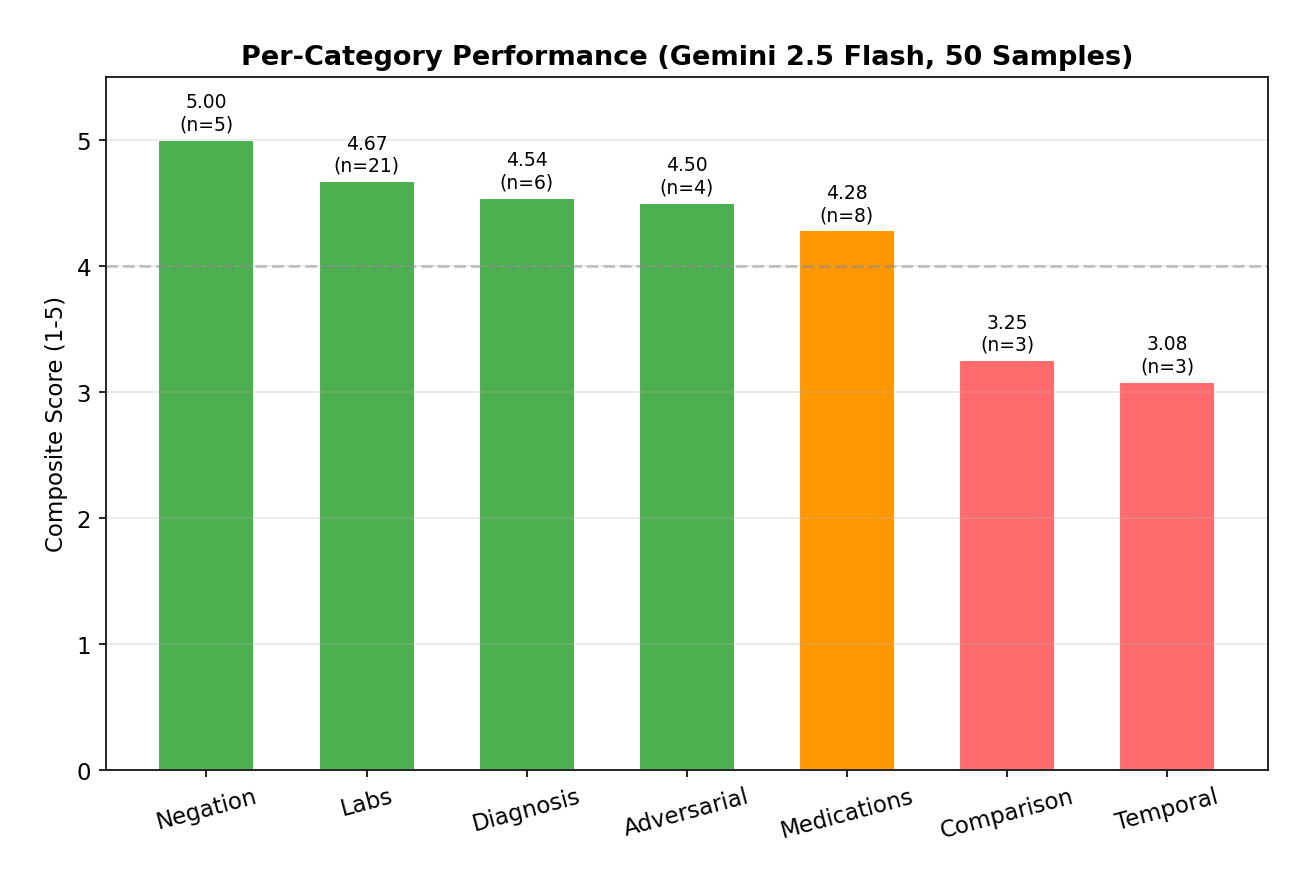
The 50 queries span 7 categories of varying difficulty. Some are nearly perfect; some are still rough.
| Category | N | Correct. | Complete. | Relev. | Safety | Composite |
|---|---|---|---|---|---|---|
| Negation | 5 | 5.00 | 5.00 | 5.00 | 5.00 | 5.00 |
| Labs | 21 | 4.60 | 4.20 | 4.90 | 5.00 | 4.67 |
| Diagnosis | 6 | 4.30 | 3.80 | 5.00 | 5.00 | 4.54 |
| Adversarial | 4 | 4.80 | 3.50 | 4.80 | 5.00 | 4.50 |
| Medications | 8 | 4.10 | 3.60 | 4.40 | 5.00 | 4.28 |
| Comparison | 3 | 2.70 | 1.70 | 3.70 | 5.00 | 3.25 |
| Temporal | 3 | 3.00 | 1.70 | 2.70 | 5.00 | 3.08 |
Negation queries scored a perfect 5.00 — the model correctly identifies when data is absent. Labs and Diagnosis (4.67, 4.54) are strong because they’re factual lookups that RAG handles well. Temporal and Comparison (3.08, 3.25) are the weak spots — cross-visit trend analysis requires connecting data across multiple chunks with date ordering, which the current retrieval layer doesn’t surface well. Date-aware chunking is the next obvious improvement.
07RAGAS Faithfulness
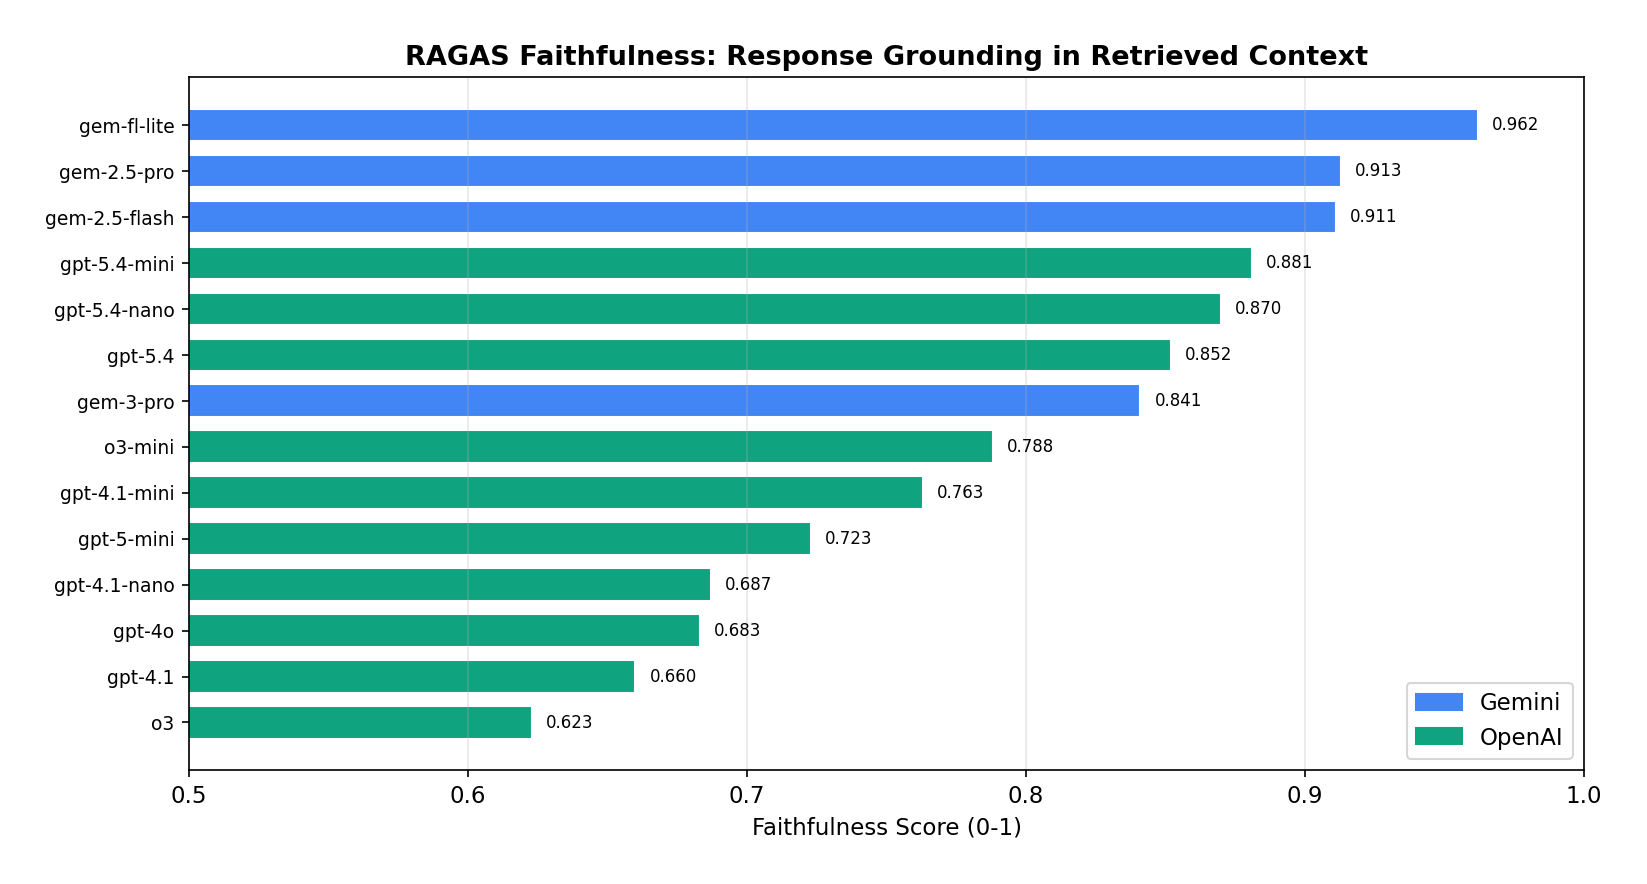
A counterintuitive hallucination tradeoff.
We computed RAGAS metrics across 14 models. Faithfulness — the rate at which a model stays grounded in retrieved context — turned out to be inversely correlated with composite score.
| Model | Faithfulness | Answer Rel. | Context Prec. | Context Recall |
|---|---|---|---|---|
| gemini-2.5-flash-lite | 0.962 | 0.822 | 0.707 | 0.633 |
| gemini-2.5-pro | 0.913 | 0.778 | 0.937 | 0.615 |
| gemini-2.5-flash | 0.911 | 0.819 | 0.875 | 0.630 |
| gpt-5.4-mini | 0.881 | 0.875 | 0.806 | 0.633 |
| gpt-5.4-nano | 0.870 | 0.834 | 0.815 | 0.633 |
| gpt-5.4 | 0.852 | 0.828 | 0.714 | 0.628 |
| gemini-3-pro | 0.841 | 0.783 | 0.737 | 0.628 |
| o3-mini | 0.788 | 0.859 | 0.815 | 0.645 |
| gpt-4.1-mini | 0.763 | 0.864 | 0.779 | 0.658 |
| gpt-5-mini | 0.723 | 0.610 | 0.690 | 0.620 |
| gpt-4.1-nano | 0.687 | 0.807 | 0.747 | 0.663 |
| gpt-4o | 0.683 | 0.822 | 0.764 | 0.643 |
| gpt-4.1 | 0.660 | 0.851 | 0.754 | 0.645 |
| o3 | 0.623 | 0.806 | 0.740 | 0.658 |
Gemini 2.5 Flash Lite scored the highest faithfulness (0.962) — it stays the most grounded in retrieved context. Notably, Gemini models all score > 0.91 faithfulness while OpenAI models all sit below 0.77. The OpenAI reasoning models (o3, gpt-4.1) win on composite score but lose on faithfulness, suggesting they confabulate more beyond the retrieved context. For medical RAG, faithfulness may matter more than composite — Flash Lite’s 0.962 with 4.27 composite could be the safer production choice over GPT-4.1 Mini’s 4.70 composite with 0.763 faithfulness.
08Sample Size Stability
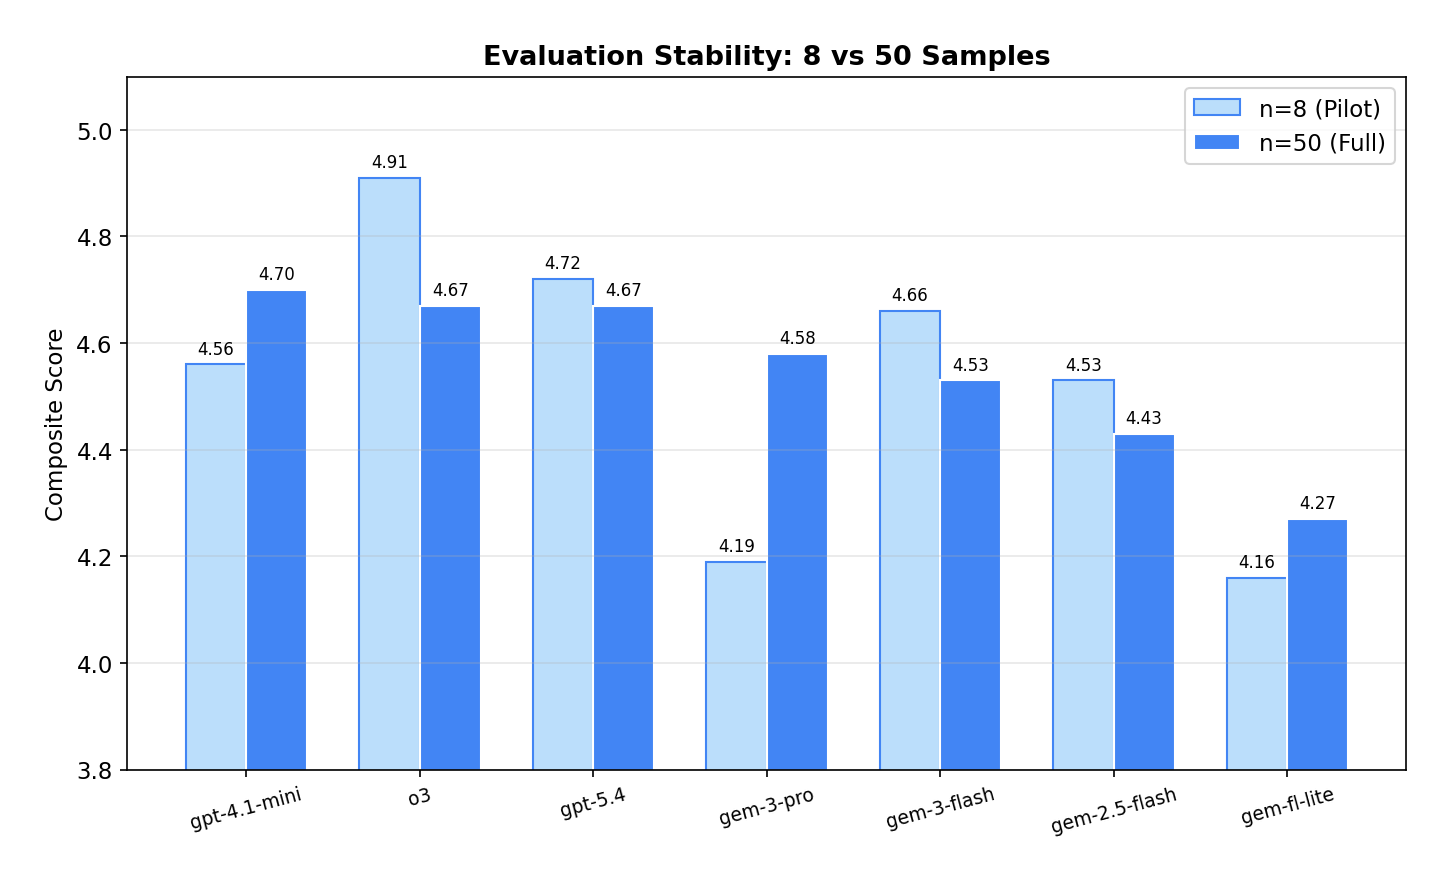
Why eight queries weren't enough.
Our pilot used 8 real patient queries. Scaling to 50 queries surfaced ranking shifts that small samples completely missed.
| Model | n=8 | n=50 | Δ |
|---|---|---|---|
| gpt-4.1-mini | 4.56 | 4.70 | +0.14 |
| o3 | 4.91 | 4.67 | −0.24 |
| gpt-5.4 | 4.72 | 4.67 | −0.05 |
| gemini-3-pro | 4.19 | 4.58 | +0.39 |
| gemini-3-flash | 4.66 | 4.53 | −0.13 |
| gemini-2.5-flash | 4.53 | 4.43 | −0.10 |
| gemini-2.5-flash-lite | 4.16 | 4.27 | +0.11 |
o3 dropped from first to third (−0.24) — its 4.91 at n=8 was inflated by small-sample variance. GPT-4.1 Mini rose to first (+0.14), proving consistent across diverse query types. Gemini 3 Pro had the biggest jump (+0.39), having been underrepresented in the 8-sample pilot. The score range compressed from 0.75 (n=8) to 0.43 (n=50). Lesson: 50+ diverse samples are the minimum for trustworthy LLM benchmarking — anything less is anecdote.
09Recommendations
What we'd actually ship.
Pick by use case. There's no single best — there's the best at quality, the best at speed, and the best at cost.
Best Overall
GPT-4.1 Mini
$0.000252 / query · 4.6 s latency · 4.70 composite
Highest composite score across all 20 models, at the cheapest non-nano price tier. The default choice for production medical RAG.
Best Budget
GPT-4.1 Nano
$0.000064 / query · 2.7 s latency · 4.49 composite
Cheapest model that still scores well. 83× cheaper than GPT-5 for comparable quality.
Best Speed
Gemini 2.5 Flash Lite
$0.000105 / query · 1.1 s latency · 4.27 composite
Fastest response time of any model tested. Also the highest faithfulness (0.962). Best for real-time UX.
Not Recommended
GPT-5 · GPT-5 Nano · Gemini 2.5 Pro
Slow, expensive, no quality advantage
GPT-5 takes 13–18 s with no measurable quality gain. Gemini 2.5 Pro performs identically to its Flash sibling at 4.3× the cost.